Holiday Gift Card Survey Results 2020
Since 2016, Gift Card Granny has sent out a survey to users for insight on gift card usage and trends for the holiday season. This year, over 2,000 US-based consumers who have visited www.giftcardgranny.com responded. Topics such as most popular retailers, purchasing behavior and virtual gift card growth were analyzed. To find out how this year compared to years past, keep reading for all the details.
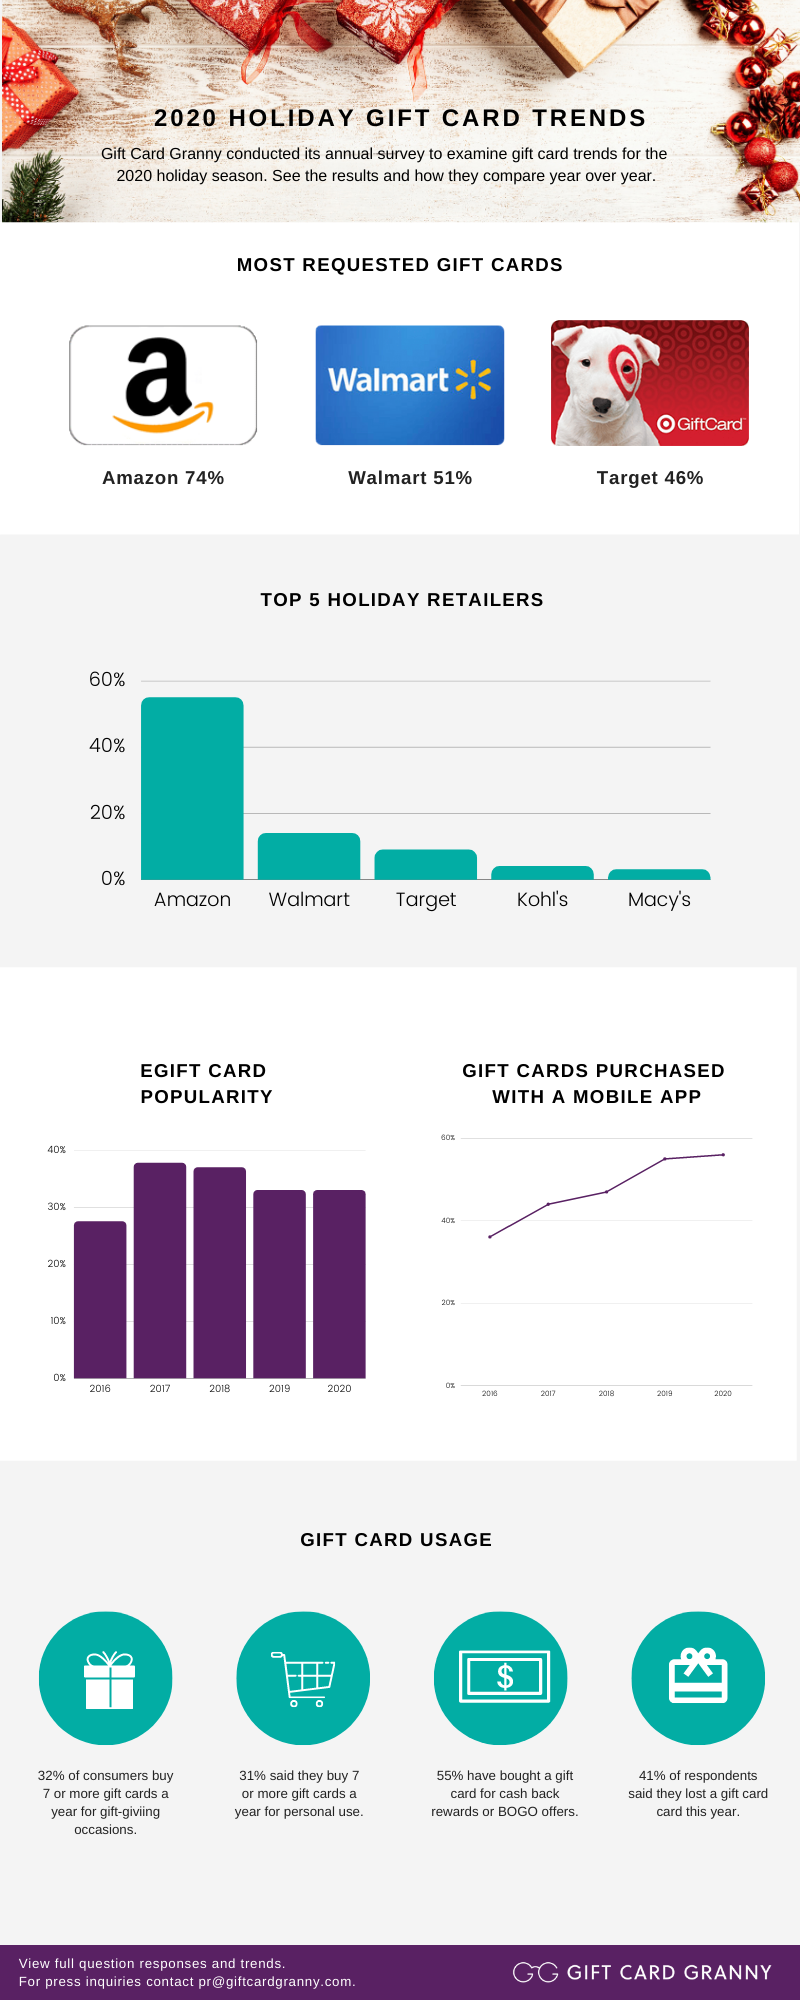
Results from the 2020 Holiday Gift Card Study
Most Requested Gift Cards
- Amazon won the popular vote at 74%.
- Walmart came in 2nd at 51%.
- Target was in third with 46%.
Gift card popularity was based on what respondents preferred to give or receive as a gift.
eGift Card Trends
- 56% of respondents indicate they have used a mobile app to purchase a gift card.
- 87% of respondents have purchased an eGift card or digital gift card.
Top 5 Retailers for Holiday Shopping
Not surprising, Amazon remains the favored retailer for holiday shopping for the third year in a row at 55%, while the following department stores are still preferred holiday shopping destinations with consumers: Walmart (14%), Target (9%), Kohl’s (4%), and Macy’s (3%).
Gift Card Purchasing and Usage
When questioned about the number of gift cards purchased per year, 32% of consumers said they typically buy seven or more gift cards a year for gift-giving occasions like birthdays and weddings. What’s more, the majority of respondents (31%) said they buy seven or more gift cards a year for their personal use.
Fifty-five percent of consumers admitted to buying a gift card based on promotions such as extra reward points, cashback rewards, or buy one, get one offers.
What’s interesting to note is while last year 63% of respondents claim to have lost a gift card, only 41% said they did this year.
Virtual Gift Card Trends
eGift card popularity remains steady over the past three years. In 2018, 2019, and 2020, 87% of consumers claim to have purchased an eGift card. As far as which type of gift card people prefer, 33% of respondents prefer digital gift cards over physical, while 29% prefer physical and 38% have no preference.
Up one percentage point up from 2019, fifty-six percent of respondents indicate they have used a mobile app to purchase a gift card. In 2019, we saw an increase of eight percentage points from 2018 and a growth of eleven percentage points from 2017.
Survey Methods
Results for this Gift Card Granny poll are based on survey responses from November 2, 2020 - November 23, 2020, with a sample of adults aged 18 and older who have visited www.giftcardgranny.com. For results based on the total sample of 2,027, the margin of sampling error is two percentage points at the 98% confidence level.